
City of York Smarter Transport Evolution Programme (STEP)
17th June 2021Summary
In 2018 City of York Council set out on an ambitious journey to build the UK's first real-time transport model outside of London in order to better understand traffic flow on the city's roads, improve traffic management and inform city planning decisions. The project was commissioned by City of York Council and funded by the Department for Transport from the National Productivity Investment Fund. The real-time model went live in June 2021.
Jon Wade of Interoperate and Andy Graham of White Willow Consulting were engaged from the start of the project to capture requirements, identify required data sources, build a prototype data platform and define the end-to-end system architecture so that the project could go out to tender to commercial providers with a clearly defined and tested specification.
We helped City of York Council achieve their goals by:
- unlocking traffic flow data from existing traffic cameras and traffic counting loops
- unlocking traffic signal timing data from York's urban traffic control (UTC) system
- building a prototype data platform to capture and visualise real-time traffic flow and signal metrics
- providing a full specification for the production data platform system (based on the prototype)
- integrating the data platform with commercial traffic modelling software (PTV Optima)
Prototype Data Platform
The prototype data platform was built using open source components and hosted on a single cloud hosted Linux server. The key components were:
- PostgreSQL database with TimescaleDB and PostGIS extensions
- Apache Kafka to provide internal message streaming between sub-components
- Grafana for data visualisation
- Custom code was written in Ruby using the Ruby on Rails web application framework

Key considerations for the data platform were that it had to:
- be capable of efficiently storing and retrieving different types of data i.e. relational, time-series and geospatial
- be generic enough to be able to handle any type of data, not limited to traffic data
- have a codebase that was testable and maintainable to allow for efficient changes
- be easy to integrate with new data sources and external systems
- be secure
Data Sources
Traffic Cameras
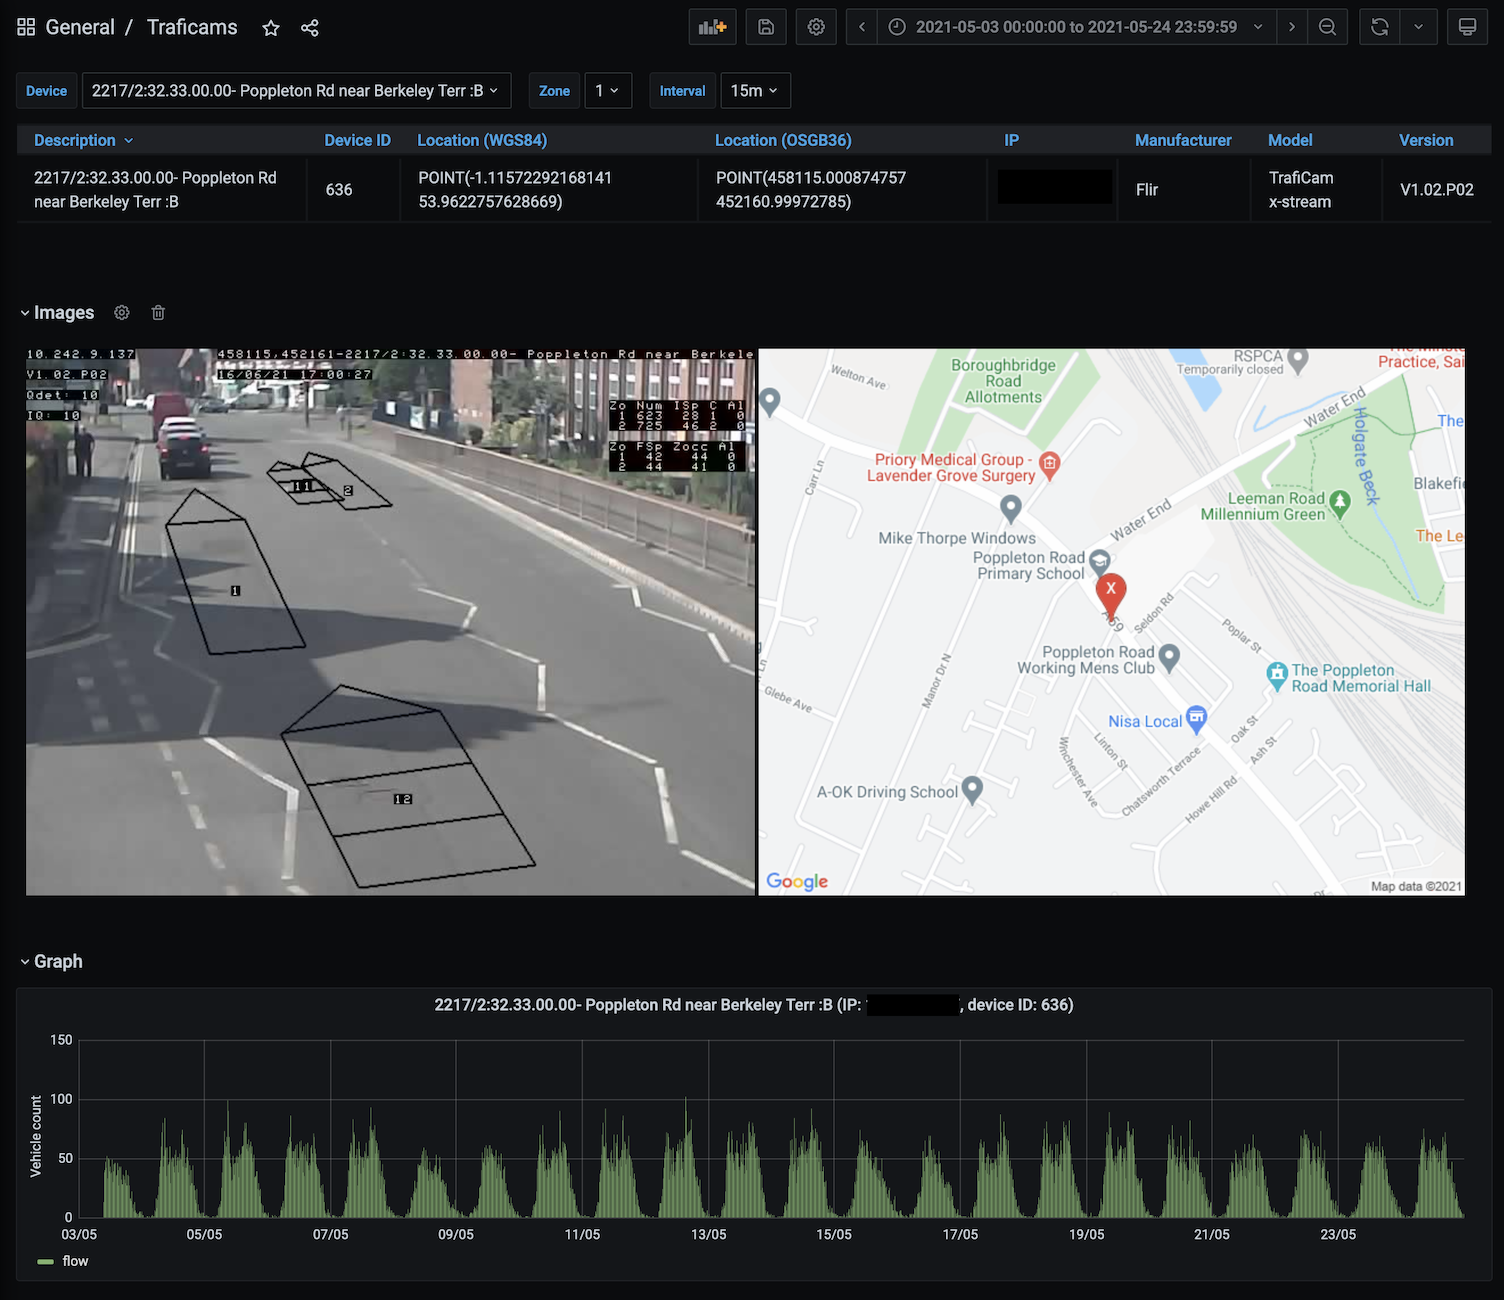
York had an existing deployment of around 130 traffic cameras (FLIR Traficams) which were technically capable of counting traffic but many were not fully configured and they were primarily being used as standard cameras by traffic Network Monitoring Officers (NMOs) to see what was happening at camera locations in reaction to an incident or reported congestion.
We deployed a custom appliance on the City of York internal network to harvest data from traffic cameras every minute and ship the data to the data platform in the cloud. Once stored in a time-series database the data could be visualised on a Grafana dashboard. We also captured the current still image from the camera and integrated with the Google Maps API so show the camera location on a map to provide additional context.
Once the traffic cameras were being polled, it allowed traffic engineers to identify cameras that hadn't been configured consistently or weren't collecting data. This provided the additional benefit of real-time auditing of the camera estate.
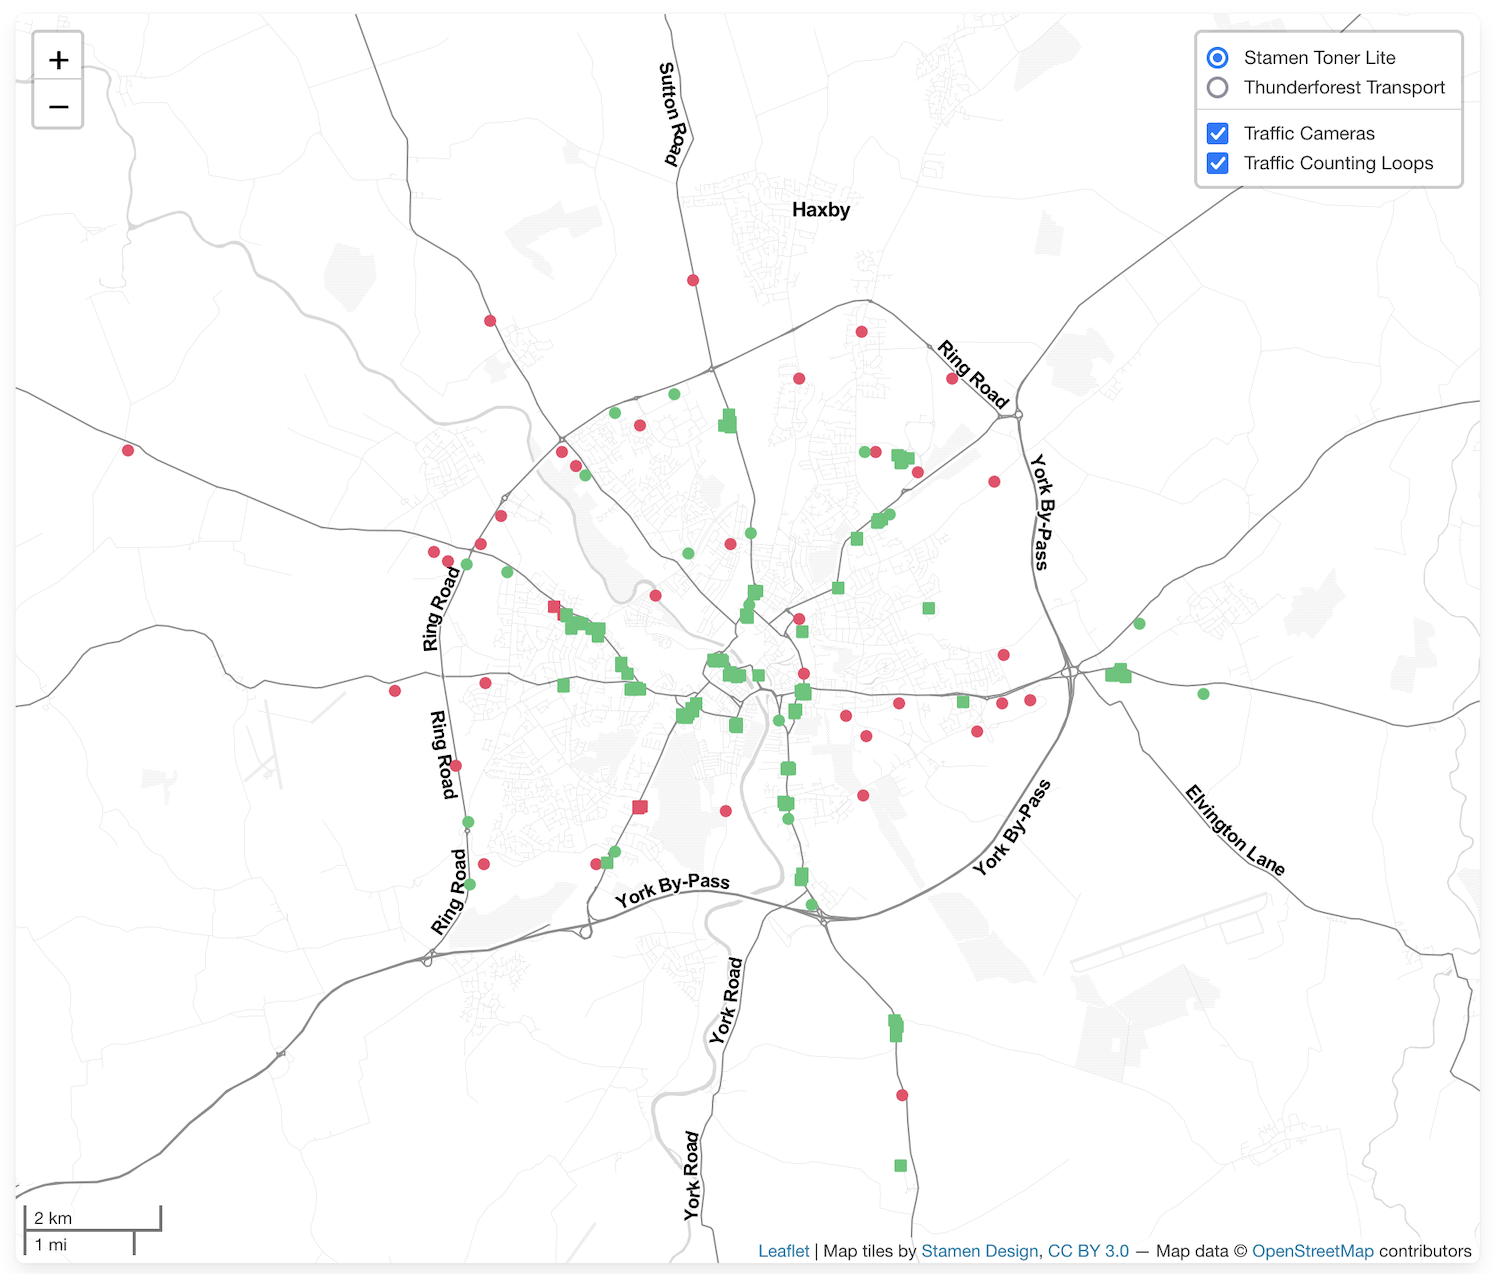
Traffic Counting Loops
York also had about 60 automatic traffic counting loops deployed across the city but the data was not being used for traffic management. It was manually downloaded from the supplier's portal on a weekly basis and used for statistical analysis elsewhere within the authority. We worked with CA Traffic who were already working on a near real-time API for their data to gain early access to their API and poll for loop data every 5 minutes.
Traffic Counting Coverage
The map below shows the coverage of traffic counting cameras and loops across the city.
Traffic Signal Timings (phase and stage)
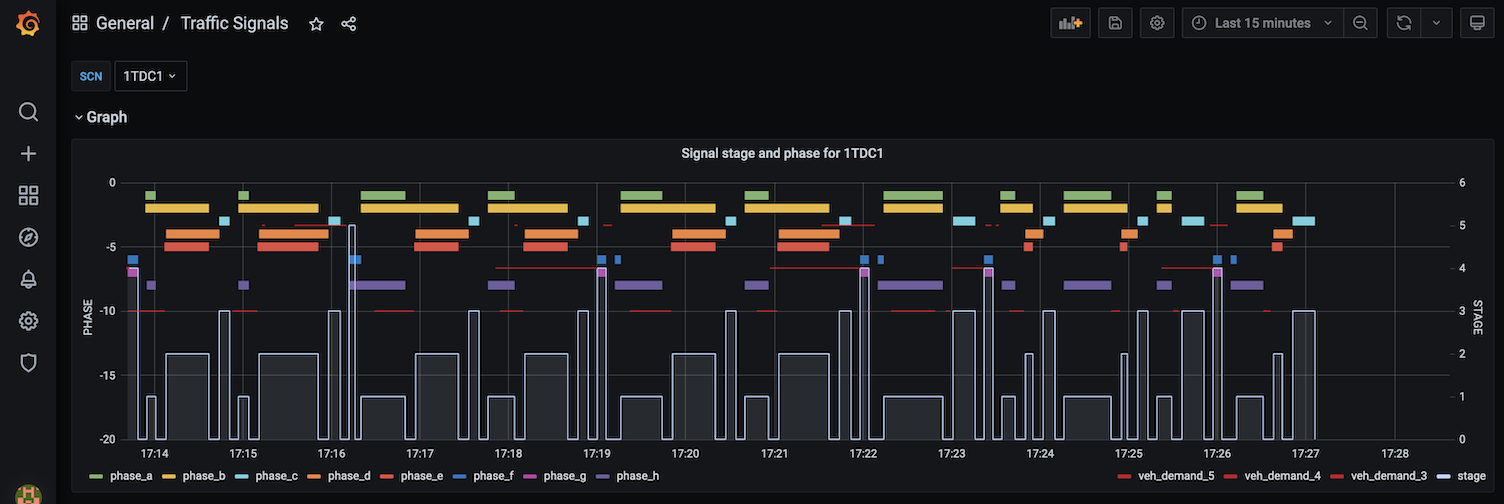
The biggest technical challenge was obtaining near real-time traffic signal timing information from York's urban traffic control (UTC) system. The UTC system didn't have any APIs to expose this data so our solution was to deploy a device to sniff raw UTMC (Urban Traffic Management and Control) messages sent via SNMP from signal controllers to the central UTC server. We used port mirroring to mirror network packets sent to the UTC server and decoded them using the Open Source LibPCAP library. The messages were then shipped to the data platform every minute where the UTMC events were processed in time order to construct signal stages and phases. These were then visualised in Grafana as shown in Figure 4.
The signal stage and phase timings are converted to cycle times and interstage timings and pushed continously to the real-time model via the PTV Optima API. The real-time model receives the data a minute or so after end of the signal cycle.
Being able to visualise traffic signal phase and stage information in Grafana provided York's traffic engineers with new insight into how traffic signals were configured and allowed them to identify any misconfigured signals which would have been impossible to detect previously.
Integration with Traffic Modelling Software
In late 2019, York awarded a contract to a consortium led by Wood Group to build a real-time traffic model of York using PTV Optima traffic modelling software. The real-time platform went live in June 2021 calibrated using traffic flow and signal timing data provided from the protoype data platform which has been collecting data since 2018. The prototype data platform is due to be replaced by a production system with long term support with contract award due mid 2021.
Agile Approach
Our agile approach and having a small team allowed us to be extremely nimble. When the COVID19 pandemic hit the UK in early 2020, a request went out from the Department for Transport to all local authorities requesting access to traffic flow data to be used as a measure of public adherence to lockdown. In under 2 hours we had developed, tested and deployed a custom RESTful API to allow York's traffic data to be accessed by the project. The Transport Technology Forum (TTF) COVID response project went on to win ITS UK project of the year.
Key outcomes
- Building a prototype data platform allowed data sources and integration requirements to be fully understood before going out to tender for the traffic modelling and data platforms.
- Focusing on systems integration and opening up existing data sources contributed to the first real-time city-wide traffic model in the UK being delivered on time and to budget as risks associated with traffic data collection and systems integration were greatly mitigated.
- Being able to visualise traffic flow and traffic signal timing data provided York's traffic engineers with deep insights into their traffic network that were previously unavailable.
- Maintaining an agile and nimble approach to development allowed for quick changes to the prototype - as evidenced by the quick response to TTF COVID Response project.
- Having a flexible architecture with a generic data platform at the hub allows for future integration of new data sources and downstream integration with external platforms (e.g. York Open Data).
Credits
Thanks to City of York Council for giving us the opportunity to work on this project and for creating a truely collaborative working environment, especially James Guilliatt and Andy Thellmann.
Thanks to PTV for their technical expertise and pragmatic approach to systems integration, especially Chiara Cianella and Michael Oliver.
Related links
Local Transport Today: Future proofing York: managing changing levels of demand
ITS UK: PTV Group successfully integrates real-time transport model in York